Vorgangs-Gantt-Diagramm
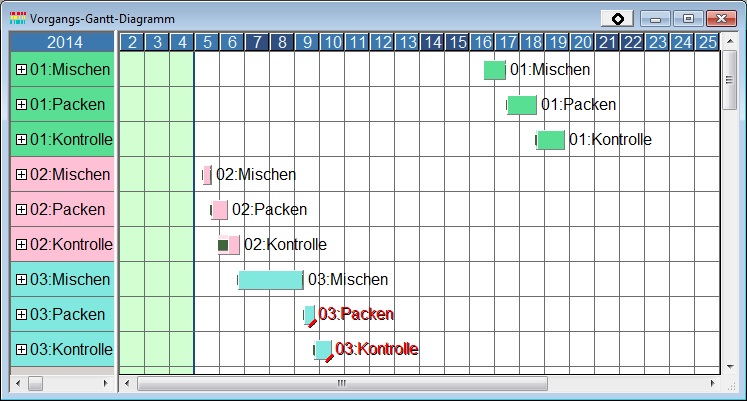
Das Vorgangs-Gantt-Diagramm ist ein Tabellenzeitdiagramm, dessen Zeilen einzelne Vorgänge enthalten.
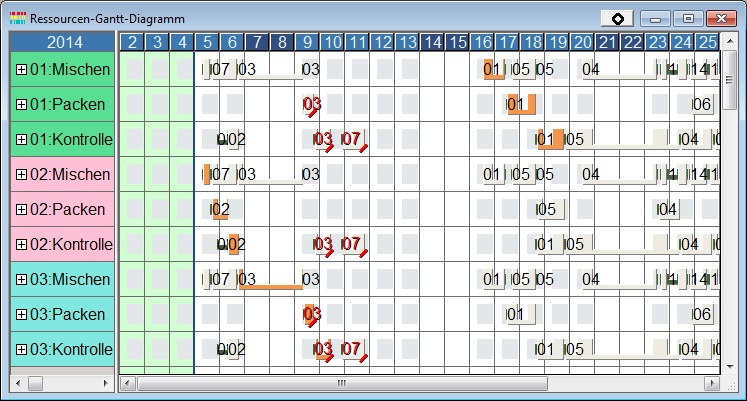
Wenn Sie [Vorgangszeileninhalt] auf "Ressourcen-Gantt-Diagramm" setzen, wird statt des Zeitdiagrammes das Ressourcen-Gantt-Diagramm mit korrespondierenden Vorgängen angezeigt. Dabei werden diese automatisch hervorgehoben.
Wird das Vorgangs-Gantt-Diagramm auf die Diagramminhalte übertragen, dann sind die Grundaktionen die gleichen wie die Vorgangszeilen des Auftrags-Gantt-Diagrammes.
Wird das Ressourcen-Gantt-Diagramm auf die Diagramminhalte übertragen, dann sind die Grundaktionen die gleichen wie die Vorgangszeilen des Ressourcen-Gantt-Diagrammes.
Inhaltsverzeichnis
Gruppiertes Vorgangs-Gantt-Diagramm
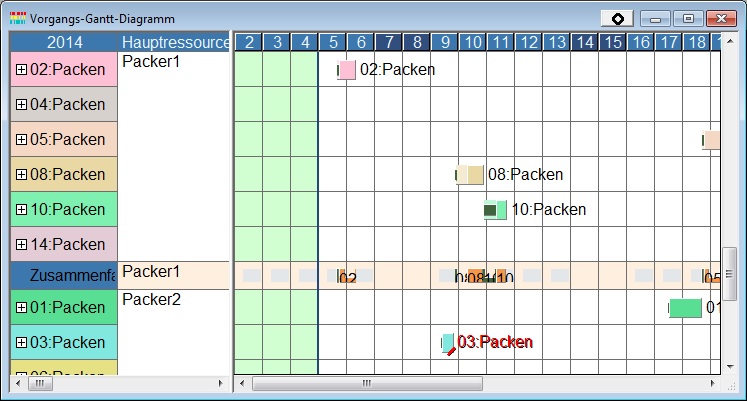
You can set "main resource"as the property for grouping by on the operation Gantt chart. Then, Resource-Gantt-Chart rows become displayed in aggregated rows in the time chart portion. The display for bars in the group shall be highlighted in the group summary row.
For split operations, note that when using the standard style groupings will be made with the main resource of the first operation of the split. Accordingly, the target which is highlighted by the aggregate rows, etc. only refers to this split operation.
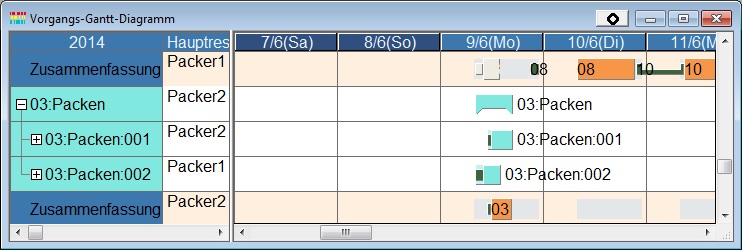
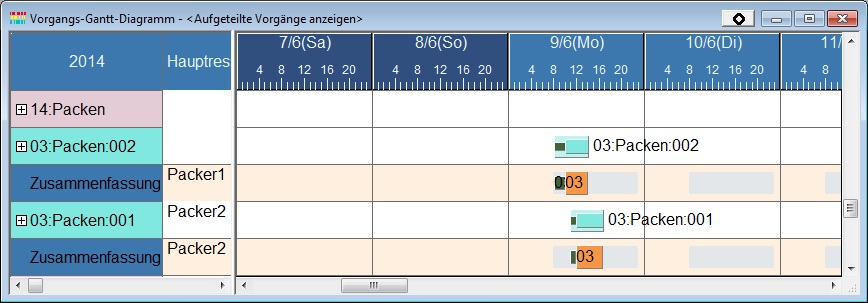
For example, the operation 03:Packing is split in the following example. However, the group target is those assigned to the resource Packer2. Therefore, only those operations shall be highlighted in the group summary row.
When the grouping is made for the styles based on the Show Divided Operations, each divided operation shall be the object of aggregation. Therefore, each divided up operation shall be highlighted.
Examples where the grouping is made for the operation Gantt chart (Item Gantt Chart)
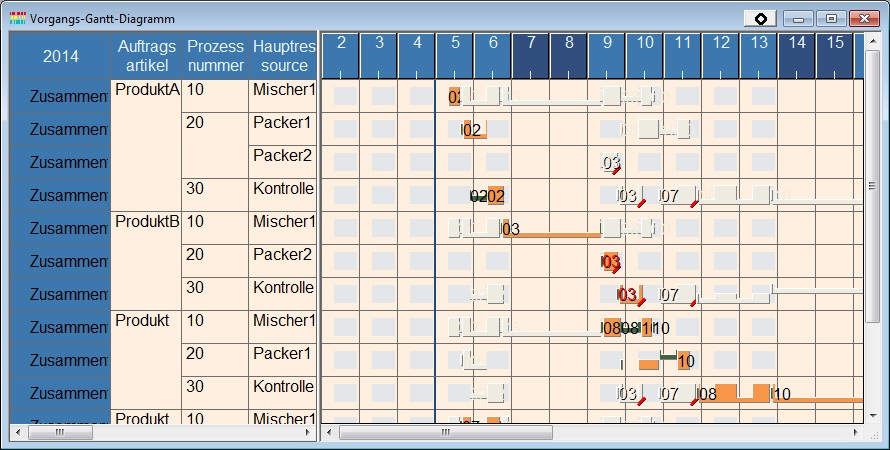
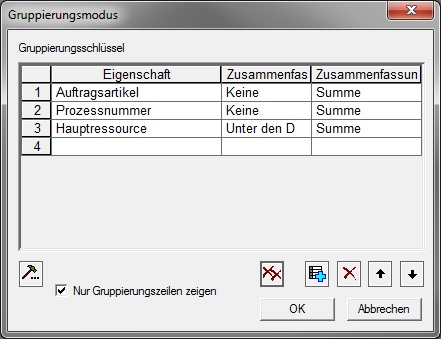
You can create a chart similar to an 'item gantt' by using a certain grouping and displaying only the group summary rows. Typically this grouping would be the item of the operation, process number and then main resource. This gives a chart which is useful to visualize the assignment of items to resources.
The grouping is made for the above chart, as shown below (The setting is already made in such a way that the ordered items are to Add Properties to operations and are to be referred to by Virtual Property)
Summary row left part text expression
If setting the Summary row left part text expression in Chart display settings (tab named table), it would be displayed in the left as summary.
Example
Displaying the item and the main resource instead of "Summary": ME.Operation.Order.Item+' - '+ME.Operation.OperationMainRes
Summary line left part color expression
The color of the summary row can be changed by the Summary line left part color expression in the table tab of chart displaying settings .
Example
Color of the item: ME.Operation.Order.Item.Color
